python-pptxの導入
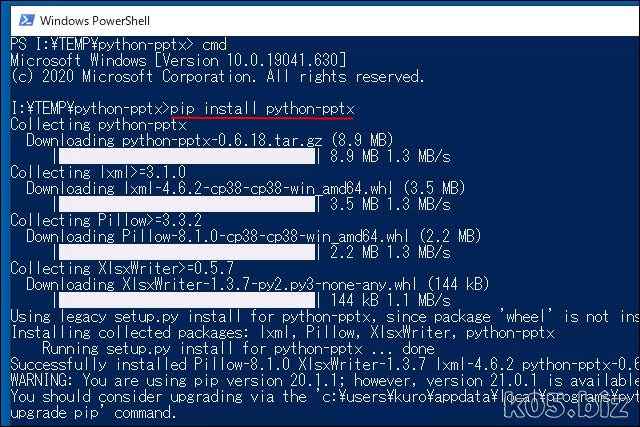
pip install python-pptx
動画での説明
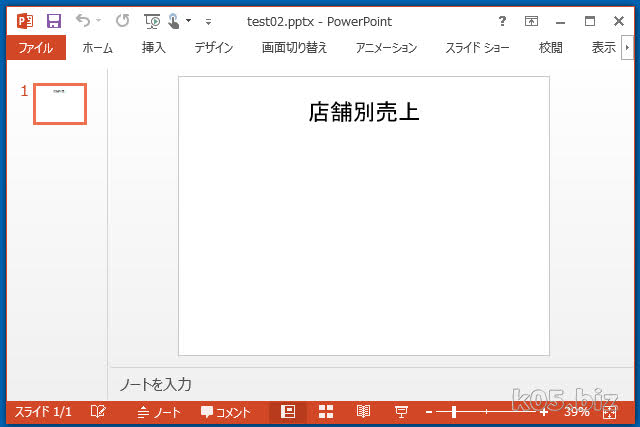
タイトル付きのスライド作成
Getting Started — python-pptx documentation
https://python-pptx.readthedocs.io/en/latest/user/quickstart.html
上記のサンプルを参考にして作成します
from pptx import Presentation
from pptx.chart.data import ChartData
from pptx.enum.chart import XL_CHART_TYPE
from pptx.util import Cm
from pptx.enum.chart import XL_LEGEND_POSITION

#-----------
# PowerPoint ファイルを新規作成
#------------
prs = Presentation()

#-----------
# タイトルのみ [5]
#------------
title_only_slide_layout = prs.slide_layouts[5]
slide = prs.slides.add_slide(title_only_slide_layout)
shapes = slide.shapes
shapes.title.text = '店舗別売上'

#----------
# ファイル出力
#----------
prs.save('test02.pptx')
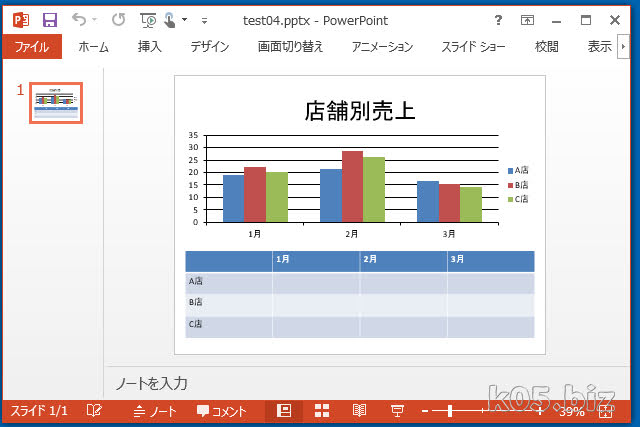
グラフと表を挿入
Getting Started — python-pptx documentation
https://python-pptx.readthedocs.io/en/latest/user/quickstart.html
Working with charts — python-pptx documentation
https://python-pptx.readthedocs.io/en/latest/user/charts.html
上記のサンプルを参考にして、グラフと表を追加します
from pptx import Presentation
from pptx.chart.data import ChartData
from pptx.enum.chart import XL_CHART_TYPE
from pptx.util import Cm
from pptx.enum.chart import XL_LEGEND_POSITION

#-----------
# Powerpointファイルを新規作成
#------------
prs = Presentation()

#-----------
# タイトルのみ [5]
#------------
title_only_slide_layout = prs.slide_layouts[5]
slide = prs.slides.add_slide(title_only_slide_layout)
shapes = slide.shapes
shapes.title.text = '店舗別売上'

#----------
# グラフ
#----------
chart_data = ChartData()
chart_data.categories = ['1月', '2月', '3月']
chart_data.add_series('A店', (19.2, 21.4, 16.7))
chart_data.add_series('B店', (22.3, 28.6, 15.2))
chart_data.add_series('C店', (20.4, 26.3, 14.2))

x, y, cx, cy = Cm(0.7), Cm(3.5), Cm(24), Cm(8)
graphic_frame = slide.shapes.add_chart(
    XL_CHART_TYPE.COLUMN_CLUSTERED, x, y, cx, cy, chart_data
)

chart = graphic_frame.chart

# 凡例
chart.has_legend = True
chart.legend.position = XL_LEGEND_POSITION.RIGHT
chart.legend.include_in_layout = False


#----------
# 表
#----------
rows = 4
cols = 4

top    = Cm(12)
left   = Cm(0.7)
width  = Cm(24)
height = Cm(6)

table = shapes.add_table(rows, cols, left, top, width, height).table

# カラム幅
table.columns[0].width = Cm(6)
table.columns[1].width = Cm(6)
table.columns[2].width = Cm(6)
table.columns[3].width = Cm(6)

# タイトル行
table.cell(0, 1).text = '1月'
table.cell(0, 2).text = '2月'
table.cell(0, 3).text = '3月'

# タイトル列
table.cell(1, 0).text = 'A店'
table.cell(2, 0).text = 'B店'
table.cell(3, 0).text = 'C店'

#----------
# ファイル出力
#----------
prs.save('test04.pptx')
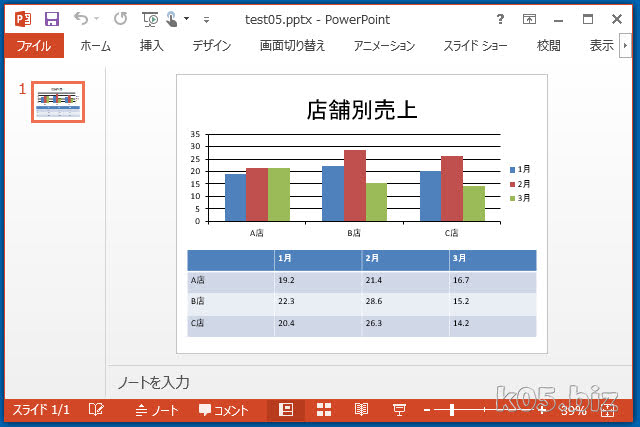
配列変数にデータを配置する
表示データを配列変数にまとめます。
from pptx import Presentation
from pptx.chart.data import ChartData
from pptx.enum.chart import XL_CHART_TYPE
from pptx.util import Cm
from pptx.enum.chart import XL_LEGEND_POSITION


#-----------
# データ配列
#------------
data =list()

data=[
['','1月', '2月', '3月'],
['A店', 19.2, 21.4, 16.7],
['B店', 22.3, 28.6, 15.2],
['C店', 20.4, 26.3, 14.2],
]

#-----------
# Powerpointファイルを新規作成
#------------
prs = Presentation()

#-----------
# タイトルのみ [5]
#------------
title_only_slide_layout = prs.slide_layouts[5]
slide = prs.slides.add_slide(title_only_slide_layout)
shapes = slide.shapes
shapes.title.text = '店舗別売上'

#----------
# グラフ
#----------
chart_data = ChartData()
chart_data.categories = [data[1][0], data[2][0], data[3][0]]
chart_data.add_series(data[0][1], (data[1][1], data[2][1], data[3][1]))
chart_data.add_series(data[0][2], (data[1][2], data[2][2], data[3][2]))
chart_data.add_series(data[0][3], (data[1][2], data[2][3], data[3][3]))

x, y, cx, cy = Cm(0.7), Cm(3.5), Cm(24), Cm(8)
graphic_frame = slide.shapes.add_chart(
    XL_CHART_TYPE.COLUMN_CLUSTERED, x, y, cx, cy, chart_data
)

chart = graphic_frame.chart

# 凡例
chart.has_legend = True
chart.legend.position = XL_LEGEND_POSITION.RIGHT
chart.legend.include_in_layout = False


#----------
# 表
#----------
rows = 4
cols = 4

top    = Cm(12)
left   = Cm(0.7)
width  = Cm(24)
height = Cm(6)

table = shapes.add_table(rows, cols, left, top, width, height).table

# カラム幅
table.columns[0].width = Cm(6)
table.columns[1].width = Cm(6)
table.columns[2].width = Cm(6)
table.columns[3].width = Cm(6)

# タイトル行
#table.cell(0, 1).text = data[1][0]
#table.cell(0, 2).text = data[2][0]
#table.cell(0, 3).text = data[3][0]

# タイトル列
#table.cell(1, 0).text = data[0][1]
#table.cell(2, 0).text = data[0][2]
#table.cell(3, 0).text = data[0][3]


# 表内のセルに値を設定
for i in range(len(data)):
    for j in range(len(data[i])):
       table.cell(i, j).text =str(data[i][j])

#----------
# ファイル出力
#----------
prs.save('test05.pptx')
CSVファイルから読み込むように変更
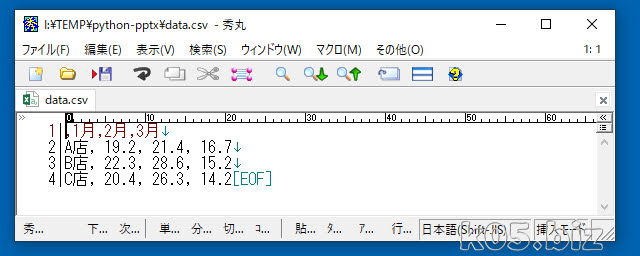
上記のようなCSVファイルを読み込んで、配列変数に代入するように変更します。
from pptx import Presentation
from pptx.chart.data import ChartData
from pptx.enum.chart import XL_CHART_TYPE
from pptx.util import Cm
from pptx.enum.chart import XL_LEGEND_POSITION
import csv


#-----------
# CSVデータを読み込んで配列に
#------------
data =list()
with open('.\data.csv') as f:
    reader = csv.reader(f)
    data = [row for row in reader]

# 数字に変換 (手抜き)
for i in range(len(data)):
    for j in range(len(data[i])):
       if i>0 and j>0 :
            data[i][j] = float(data[i][j])

#print(data);

#-----------
# Powerpointファイルを新規作成
#------------
prs = Presentation()

#---------
# この辺りの処理は同じなので省略
#--------

#----------
# ファイル出力
#----------
prs.save('test06.pptx')
スポンサーリンク


